iPhone 14 vs. iPhone 13 Depreciation Report
iPhone 14 Loses Twice as Much Value as iPhone 13 Post Launch BUT 14 Pro Max Outperforms 2021 Range!
UNITED STATES, September 29, 2022 /EINPresswire.com/ -- – 10 Days post-launch, iPhone 14 range depreciates more than double that of iPhone 13
– iPhone 14 Pro Max outperforms 2021 iPhone 13 Pro Max range by 1.8%, in just ten days
– iPhone 14 Pro and Pro Max depreciate at a similar rate to 13 Pro and Pro Max ranges
Apple released its iPhone 14 series smartphones on September 16, 2022. SellCell.com, the USA's No 1 tech price comparison site has reviewed the iPhone 14's resale values to identify which models in the new range are holding or losing their value the fastest. Phone owners are already trading-in iPhone 14 series smartphones; and tech buyers have now set the after market prices across the full range. SellCell has analysed the early resale values of the iPhone 14 against its MSRP, to understand the levels of depreciation vs. the same 10-day period after Apple launched the iPhone 13 in 2021. Is the new iPhone 14 range losing value faster in the first few weeks after launch than the hugely successful iPhone 13 range?
Let’s look at the numbers. Full report and data can be found here: (Reference:) iPhone 14 Depreciation Report
Key Findings
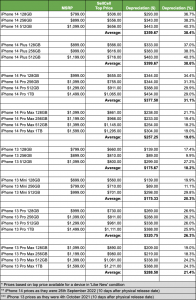
- The iPhone 14 512 GB is Apple’s worst performer of its 2022 handsets, losing 40.3% of its value in depreciation against its MSRP. The iPhone 13 Mini 512 GB was last year’s fastest depreciating model, losing 29.8%, followed by the iPhone 13 512 GB, losing 27.2%.
- The base range—the iPhone 14—lost the most value in the ten days since launch, dropping by 38.4% on average.
This compares to the iPhone 13 base range, which only lost 18.2% of its value on average, in the same 10-day, post-launch period in 2021.
iPhone 14 Pro Max series performs best overall, losing only 19.6% of its value on average, in 10 days, compared to the iPhone 13 Pro Max range, which lost 21.4% over the same time period.
- With deprecation at 18.2%, the 14 Pro Max 512 GB model is Apple’s best performer of 2022. 2021 saw the 13 256 GB performing best, losing only 9.9% of its value.
Data Summary (see charts here)
The fastest depreciating models are all iPhone 14 handsets 10 days post launch, and three of them aren’t even in stores yet (at the time of writing). On a hugely positive note for Apple fans, the iPhone 14 Pro Max 512 GB is one of the slowest depreciators across both ranges 10 days in, outperforming almost all models in the 13 range.
Of the handsets Apple has put in stores, figures provide some encouragement. The base range iPhone 14—Apple’s standard model—has lost 38.4% on average. The 128, 256, and 512 GB models have seen depreciation of 36.7%, 38.2%, and 40.3% respectively. Anyone plumping for the maximum storage version of this range will likely balk at a 40.3% nosedive in value; the worst of the three models, and a cash loss of $443.00 against the MSRP.
Looking at 2021’s equivalent, the standard edition iPhone 13, we see things were a lot different. In fact, the iPhone 13 256 GB was last year’s best-performing handset in the ten days following its 2021 launch, with depreciation at 9.9%. Overall, the standard iPhone 14 range has seen depreciation more than double that of the iPhone 13 equivalent. It has lost 38.4% ($359.67) of its value against the three standard iPhone 13 models at 18.2%.
This is likely down to several factors. The cost-of-living crisis means many people simply aren’t upgrading their handsets this year. Plus, there is a perception among some Apple fans that the standard 14 offers little more than the (now less expensive) iPhone 13 base model. So there is less incentive to upgrade.
Things aren’t looking as bad for the 14 Pro range. On average, depreciation stands at 31.1% ($377.50) across the four models, with the 128, 256, and 512 GB, and 1 TB models losing 34.4%, 31.3%, 29.9%, and 29.0%. The same iPhone 13 range lost 26.3% of its value on average, across four handsets, in 2021.
iPhone 14 Max Pro is outperforming the 2021 equivalent
However, despite the very real cost-of-living crisis, the current state of financial affairs hasn’t stopped iPhone fans investing in the most expensive Pro Max range. Depreciation is an average of 19.6% ($257.25) with all four handsets considered, meaning demand is highest for these particular models. The 128, 256, 512, GB, and the 1 TB versions have seen depreciation hitting 21.7%, 19.4%, 18.2%, and 19.0% respectively. This means the 14 Pro Max range has performed better than the 2021 13 Pro Max range, which lost 21.4% of its value on average, in the ten days following its release last year.
iPhone 14 Max Pro Could Save the Day
It has to be said, compared to recent years, the value retention of the iPhone 14 range is a little underwhelming at the lower end of the price spectrum. Losing over 40% of a handset’s value in just 10 days is practically unheard of in Apple terms. This said, the 14 Pro Max range is performing extremely well, and is Apple’s most expensive device, meaning people are willing to pay for the rich feature set the flagship 14 Pro Max range offers, even in the face of a financial crisis. This could be Apple’s 2022 winner.
We may well see the Plus range turning things around even more for Apple, particularly considering the cost-of-living crisis we’re all currently experiencing and the fact that many people are downgrading their handsets to deal with mounting financial strain. Time will tell.
Sarah McConomy
SellCell.com
sarah.mcconomy@sellcell.com
Visit us on social media:
Facebook
Twitter
EIN Presswire does not exercise editorial control over third-party content provided, uploaded, published, or distributed by users of EIN Presswire. We are a distributor, not a publisher, of 3rd party content. Such content may contain the views, opinions, statements, offers, and other material of the respective users, suppliers, participants, or authors.


